
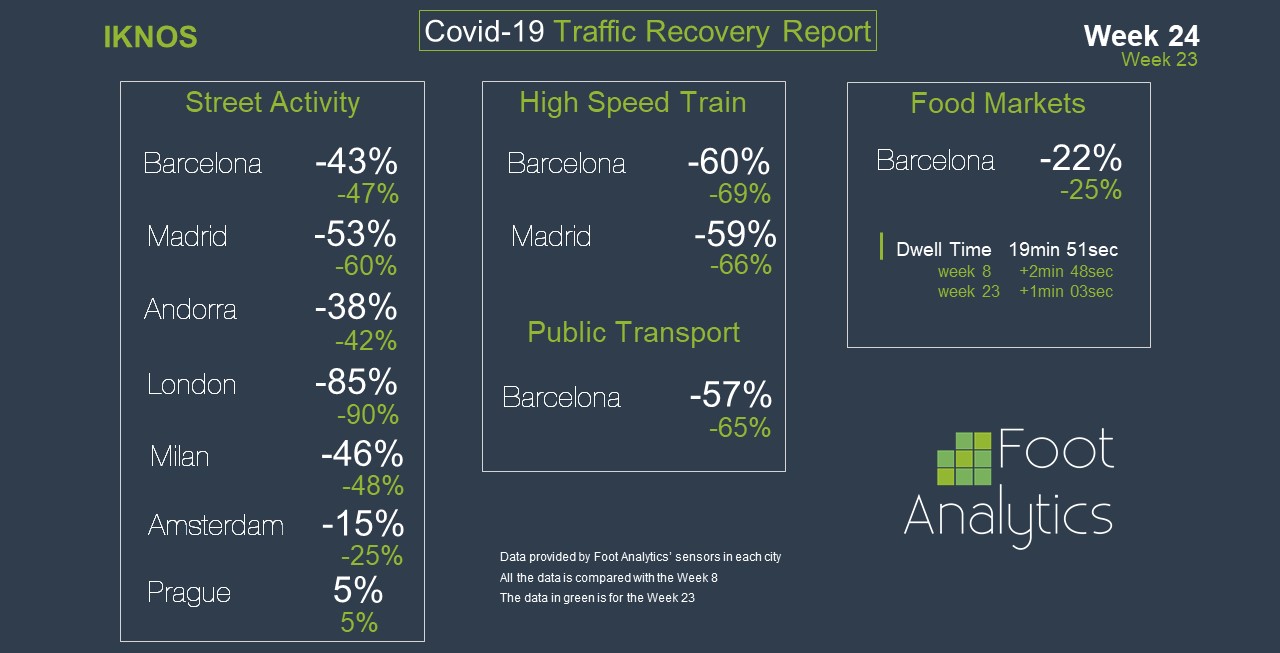
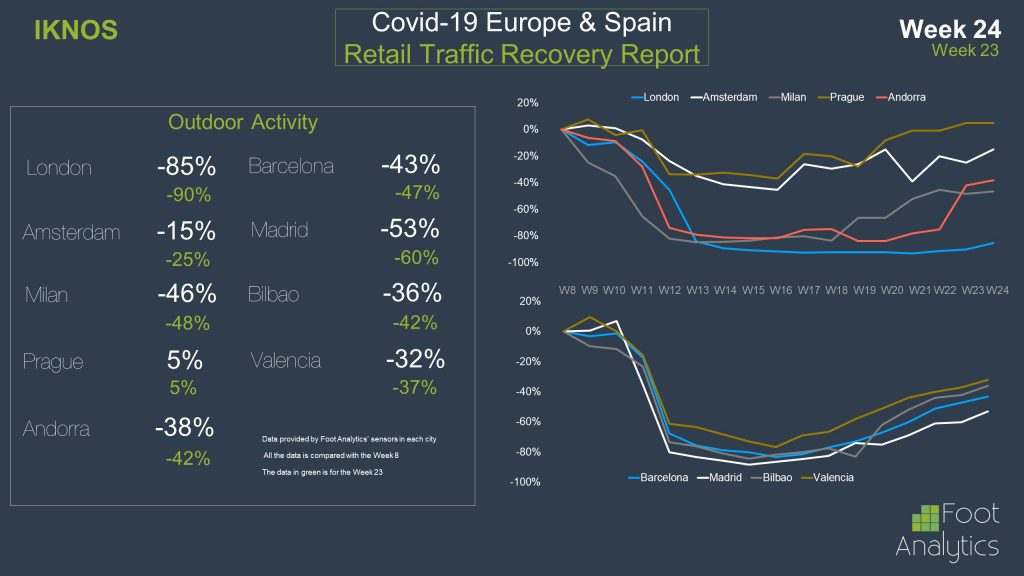
In our ninth Street Traffic Recovery Report, we are sharing and analyzing data on post lockdown recovery in terms of the traffic of people in Week 24. Week 24 presented the best data we have analyzed so far, showing clear signs of recovery from the pandemic all over the European cities analyzed. If Prague is no longer a surprise, registering a +5% compared to traffic on Week 8 for the second consecutive week, Amsterdam was finally back to a promising -15% of traffic, jumping 10pp forward from Week 23 and being the second-best city in terms of street traffic recovery among the ones analyzed. Southern European cities also witnessed a strong come back, with Barcelona overtaking Milan and scoring an impressive -43%, that is 4pp higher than Week 23, against the -46% of Milan. Madrid followed slightly behind by scoring -53% but registering a bounce forward of 7pp, the most significant increase among the two cities above mentioned. Moreover, it seems that London has finally started to recover at a considerable pace, with street traffic recovering by 5pp and scoring a -85% compared to Week 8.
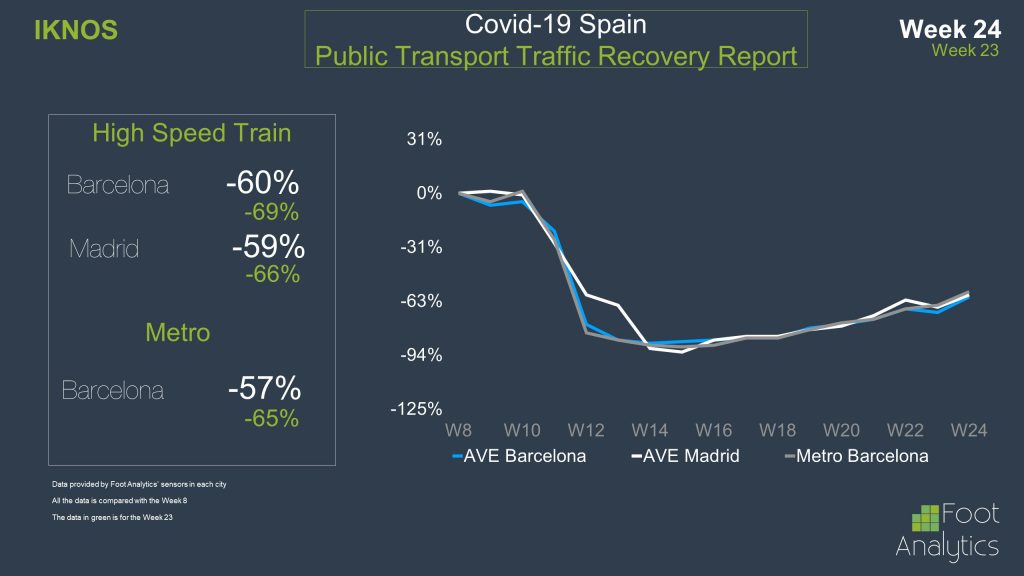
Moving to the analysis of some of the related cities’ services, significant changes happened during Week 24, as visible in the exhibits. Starting from traffic measurement on public transports, the high-speed train connecting the cities of Barcelona and Madrid finally witnessed a sharp increase, respectively by 9pp and 7pp. Despite the traffic being still down to -60%, the significant increase saw during Week 24 sets promising expectations for this current week. The traffic increased significantly also among the Barcelona Metro Service, up by 7pp from the previous week and registering a -57%.
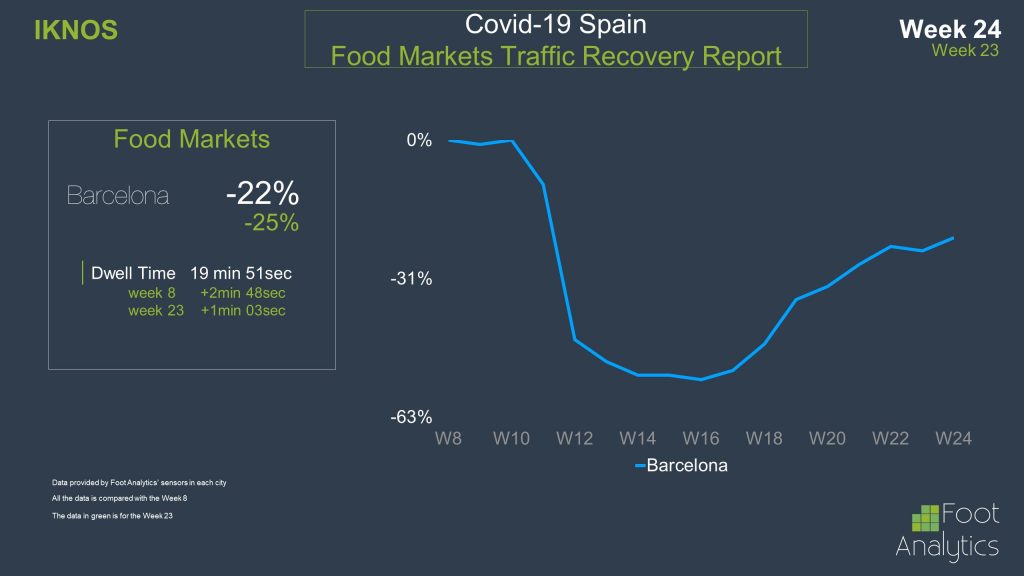
Finally, traffic recovered also inside the Food Markets in Barcelona, down only by -22% compared to -25% of week 23. A very interesting data is the one regarding the time spent by people inside the Food Markets; the dwell time unexpectedly rose up by 1 minute compared to Week 23 and was up by 2 minutes compared to the pre-Covid-19 scenario. An explanation to this piece of information could come from a change in the customers’ behaviour inside the markets, with people feeling safer in spending more time in public spaces and not rushing for a quick groceries shopping.
On the excitement of the data just analyzed, we are positively looking forward to knowing how the data will change for Week 25. Stay connected!