
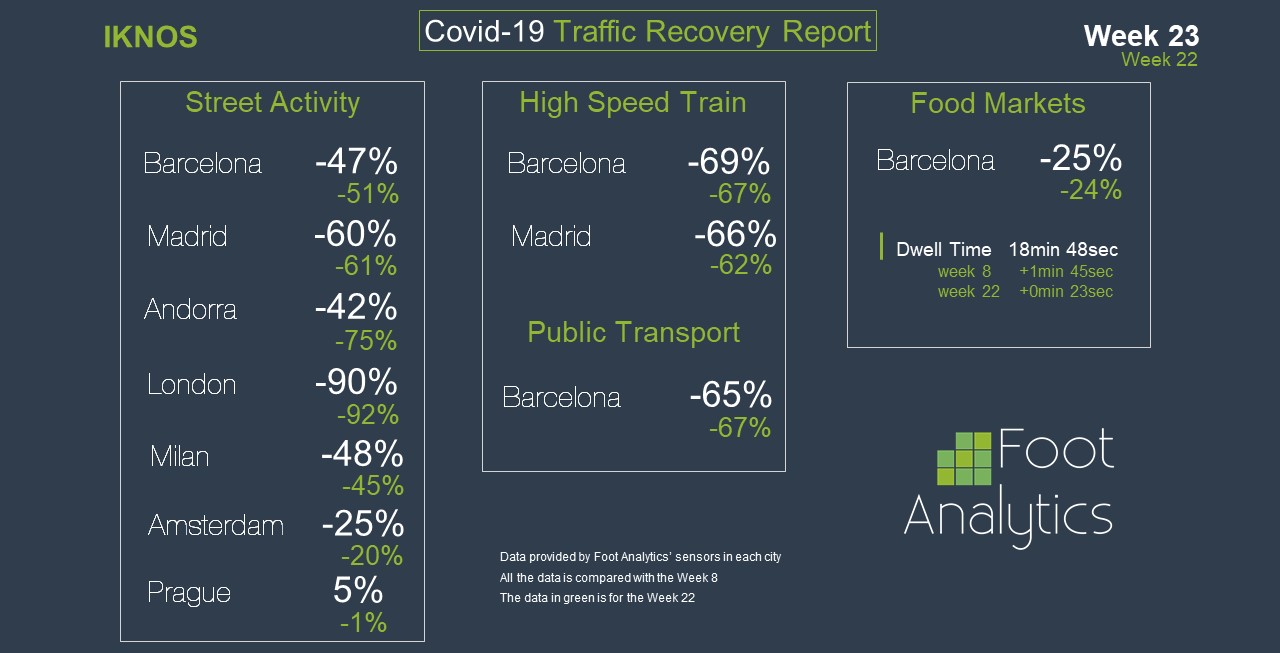
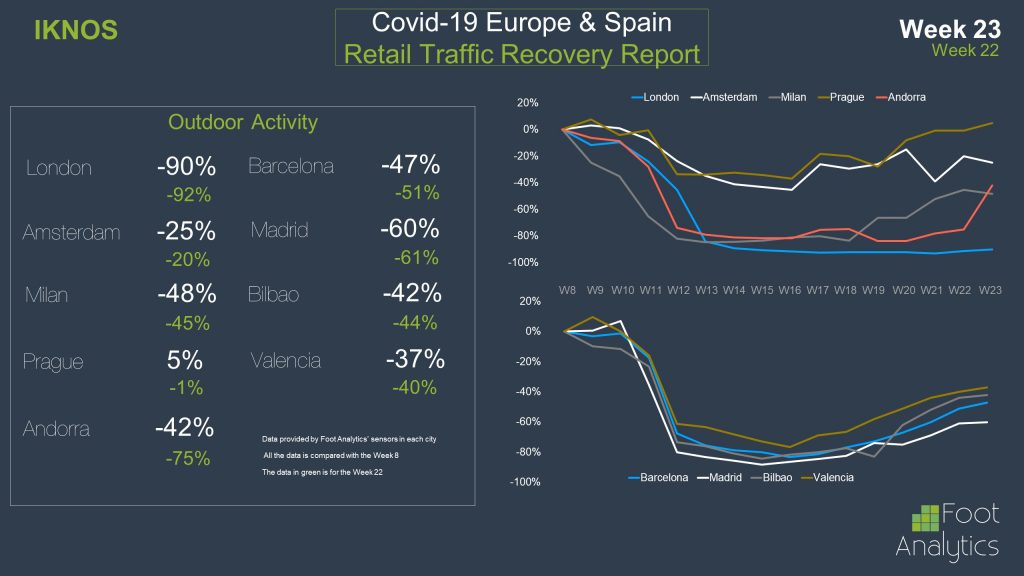
In our eighth Street Traffic Recovery Report, we are sharing and analyzing data on post lockdown recovery in terms of the traffic of people in Week 23. Street activity kept decreasing following the recovery trend showed in the previous weeks. Prague, that had always been the city showing faster signs of recovery, registered a +5% on traffic compared to Week 8 (what we refer to one of the previous weeks before general lockdown), meaning that traffic of people is now even higher than in the pre Covid-19 scenario; we are happy to say that we can consider Prague to be fully recovered in terms of traffic. Amsterdam saw instead a decrease by 5pp in the overall traffic, although the data was probably affected by the one-day bank holiday in the Netherlands of last week. The other cities in Europe were still lagging behind in terms of numbers, although recovering week by week; Barcelona and Milan registered around an overall -50% with regards to Week 8, followed closely by Madrid that registered instead a -60% overall. Finally, London started to see some small signs of recovery as well, with traffic growing by 2pp going from a -92% to a -90%. Hopefully, this data could represent the begin of a fast recovery for London.
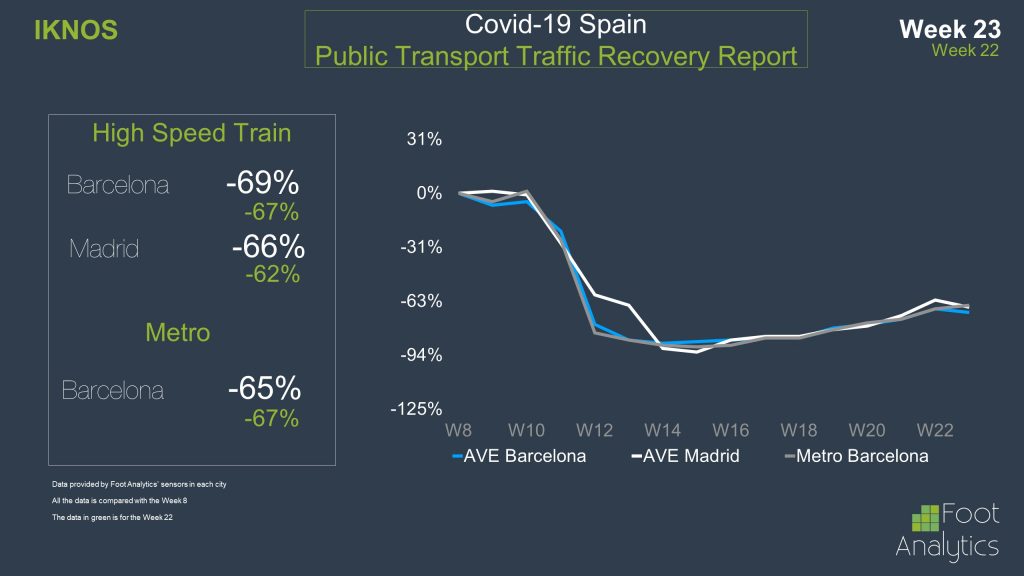
Switching to the traffic analysis among some of the cities’ services, some strange behaviours can be identified both among public transportation services and food markets. In fact, as visible from the exhibits, the high-speed train serving the cities of Barcelona and Madrid witnessed a decrease in traffic, down by 2pp in Barcelona and by 4pp in Madrid; however, at the same time, the Barcelona Metro Service experienced an increase in traffic of 2pp, reaching a -65% compared to the pre-pandemic situation.
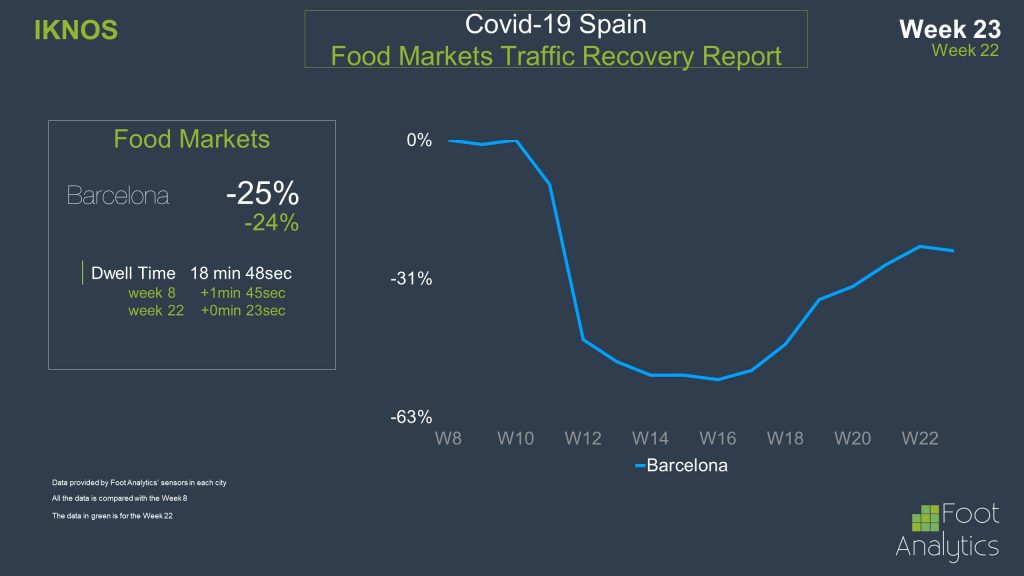
Traffic in food markets in Barcelona also decreased for the first time since our data measurement, going down by 1pp and registering a -25% compared to Week 8; the dwell time of people in the food markets slightly increased by around 30 seconds from Week 22, still around 2 minutes higher to the situation pre-pandemic.
In general, Week 23 pictured a positive scenario in which traffic was still recovering among almost all the cities analyzed. Despite the unexpected data concerning the traffic on cities’ services, there is optimism around the data about the current week, that will be visible next week as always. Stay connected!